Getting useful ROI stats from customers can feel impossible – but it doesn’t have to be. Product marketing expert Jason Oakley (Productive PMM) shares creative approaches that actually work.
Let’s be honest: getting customers to go on the record with specific ROI stats about your product is a huge blocker for customer and product marketers.
We’ve all been there. You have an incredible customer who loves your product, but when you ask them to share some numbers for a case study, things suddenly get… complicated.
Why? There are several common roadblocks:
- It might be confidential information they can’t share with competitors
- Your champion doesn’t want to claim credit for results that multiple teams contributed to
- Legal and compliance teams have restrictive policies about public endorsements
- The customer simply hasn’t tracked the specific metrics needed to calculate ROI
This creates a real challenge, especially since 51% of B2B buyers say ROI stats are the most trustworthy form of evidence (based on our research of 619 B2B buyers).
The solution: anonymous proof points that actually work
Here’s the good news: you don’t necessarily need named customer metrics to prove your product works. Anonymous proof points and benchmark stats can be just as powerful – sometimes even more so because they represent your broader customer base rather than one outlier success story.
And, the even better news: you can gather all of these valuable little ROI nuggets in a simple customer survey. (Which the UserEvidence team is making even easier with their 7 best survey templates that you can grab right now.)
Here are 10 creative approaches that leading B2B brands are using:
1. “Where” instead of “how much”
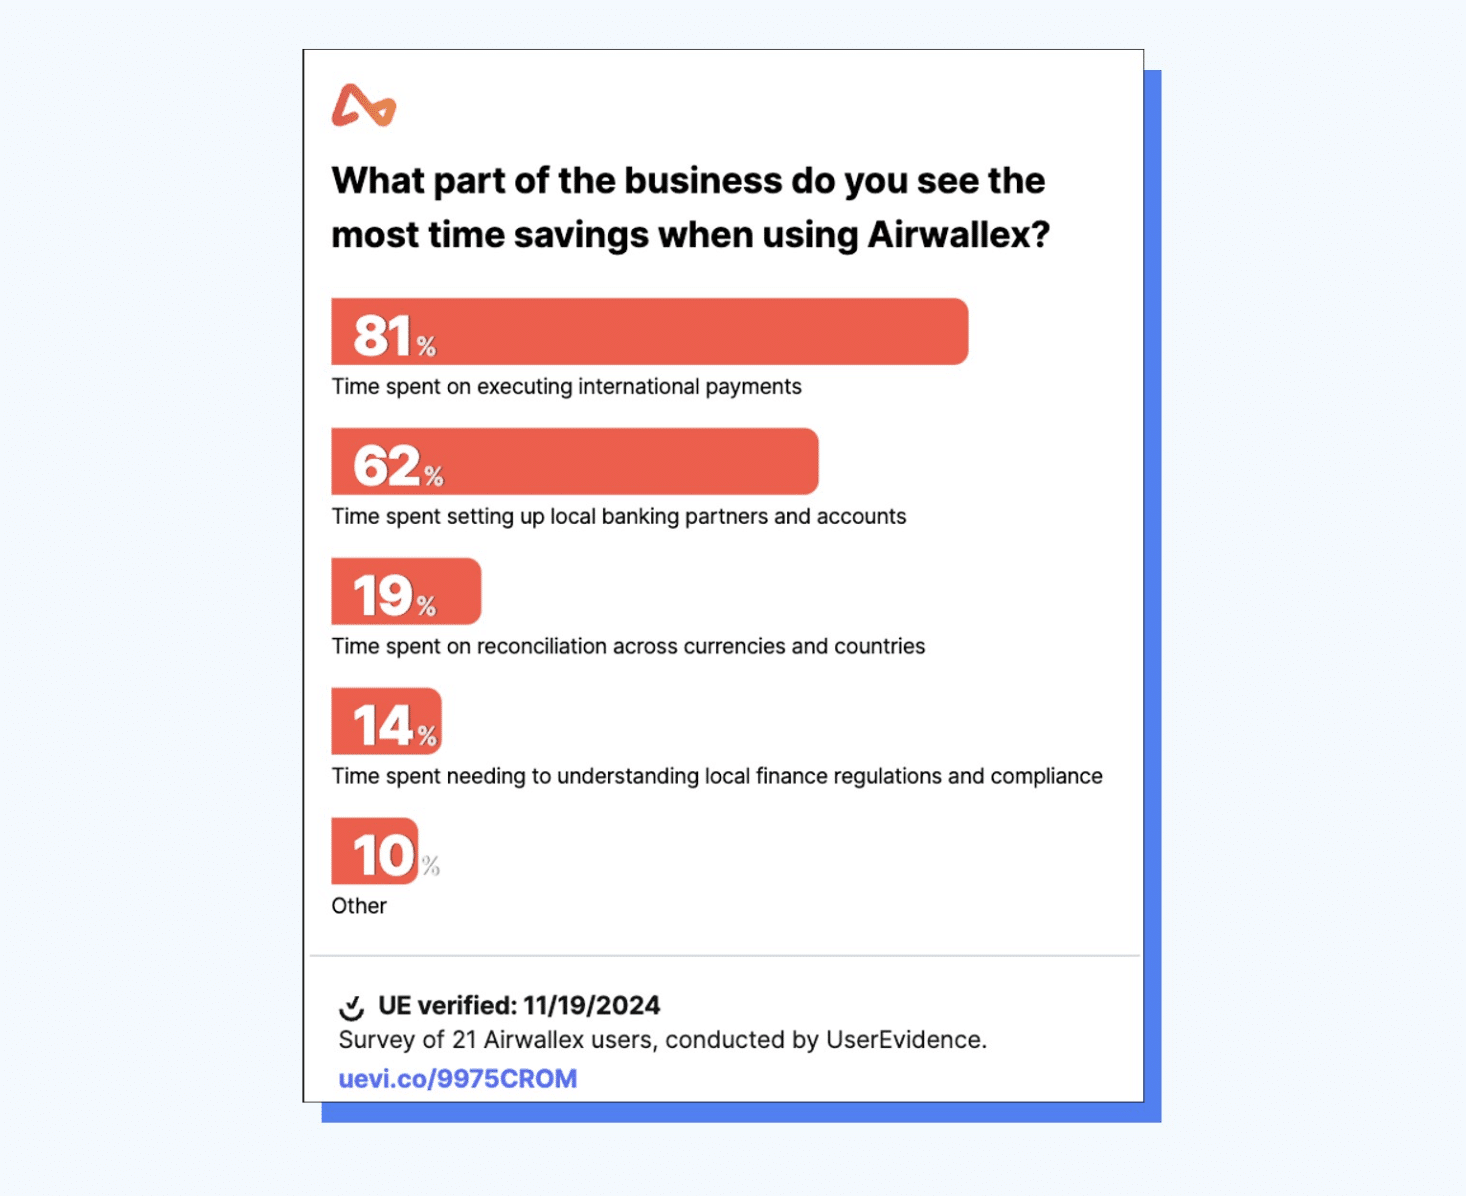
Instead of asking “how much time have you saved?” Airwallex asks customers WHERE they see the most time savings.
Their survey found:
- 81% see the most savings in executing international payments
- 62% in setting up banking partners and accounts
- 19% in reconciliation across currencies
This approach immediately builds trust that time savings will happen in multiple areas of the business – without forcing customers to quantify exact hours saved.
2. “How do we help you do X?”
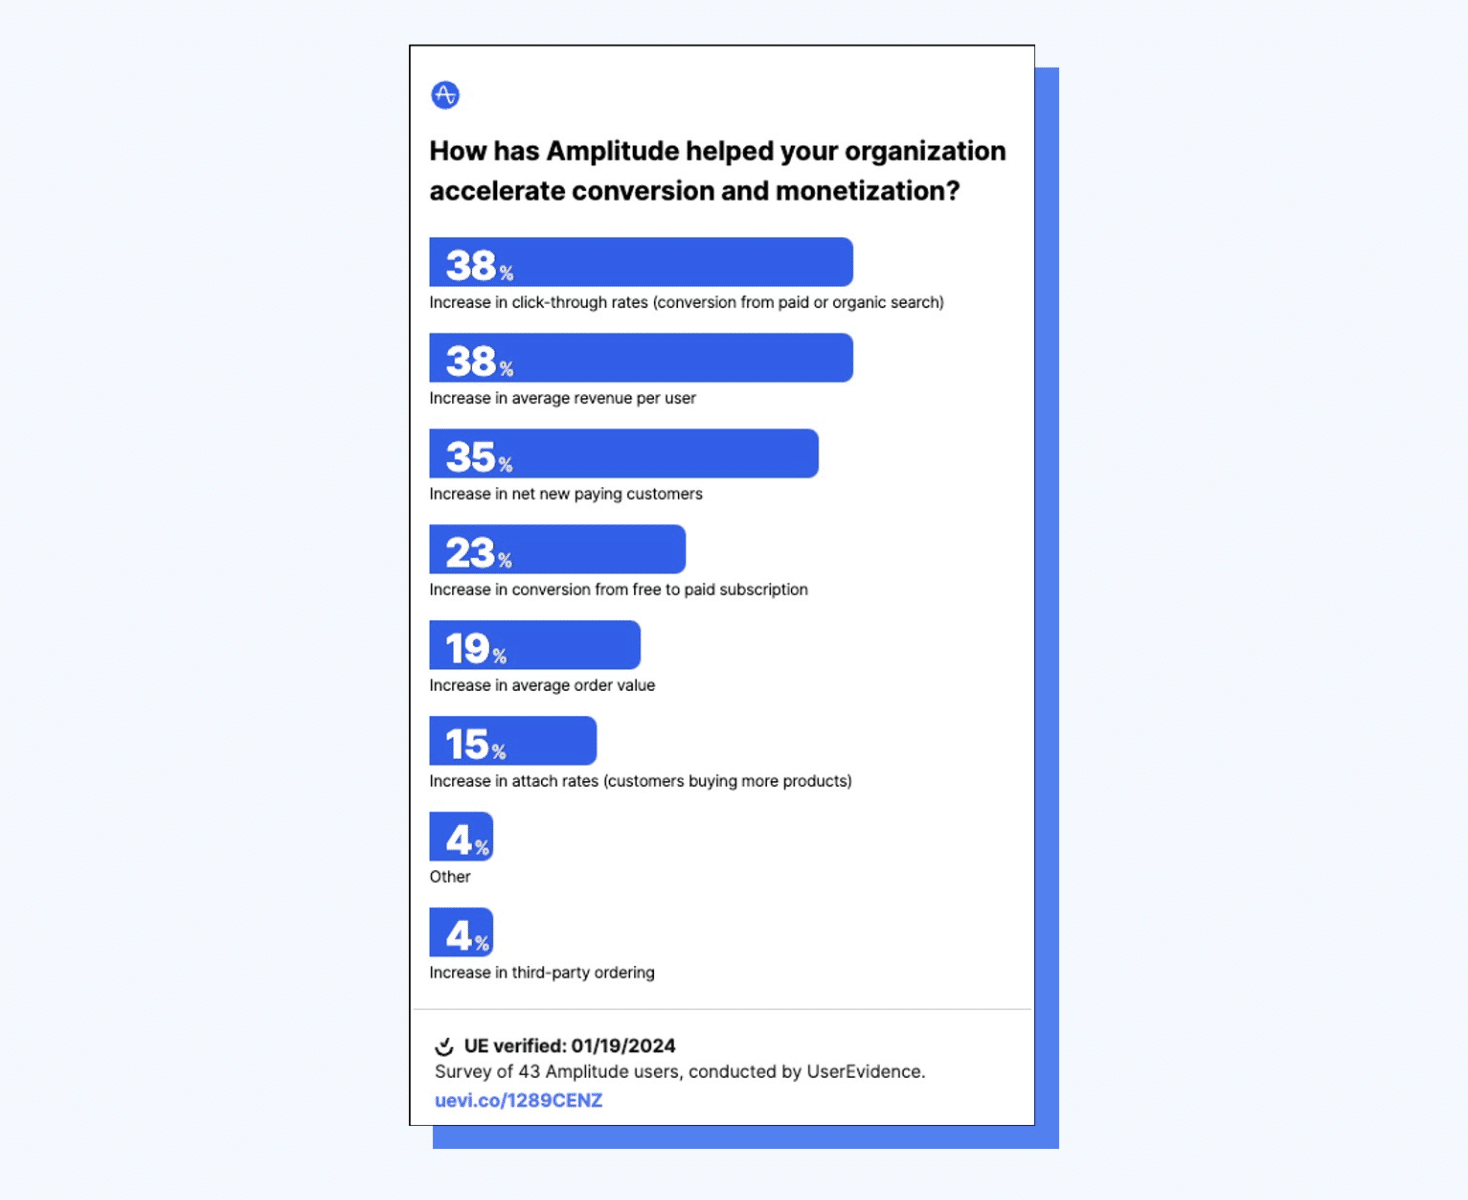
Amplitude assumes buyers are seeing value but asks them to identify specifically where. Their survey asked: “How has Amplitude helped your organization accelerate conversion and monetization?”
The results highlight multiple impact areas:
- 38% increase in click-through rates
- 38% increase in average revenue per user
- 35% increase in net new paying customers
This validates that their product delivers on its core promise while showcasing the specific areas where customers see results.
3. Who did customers choose you over?
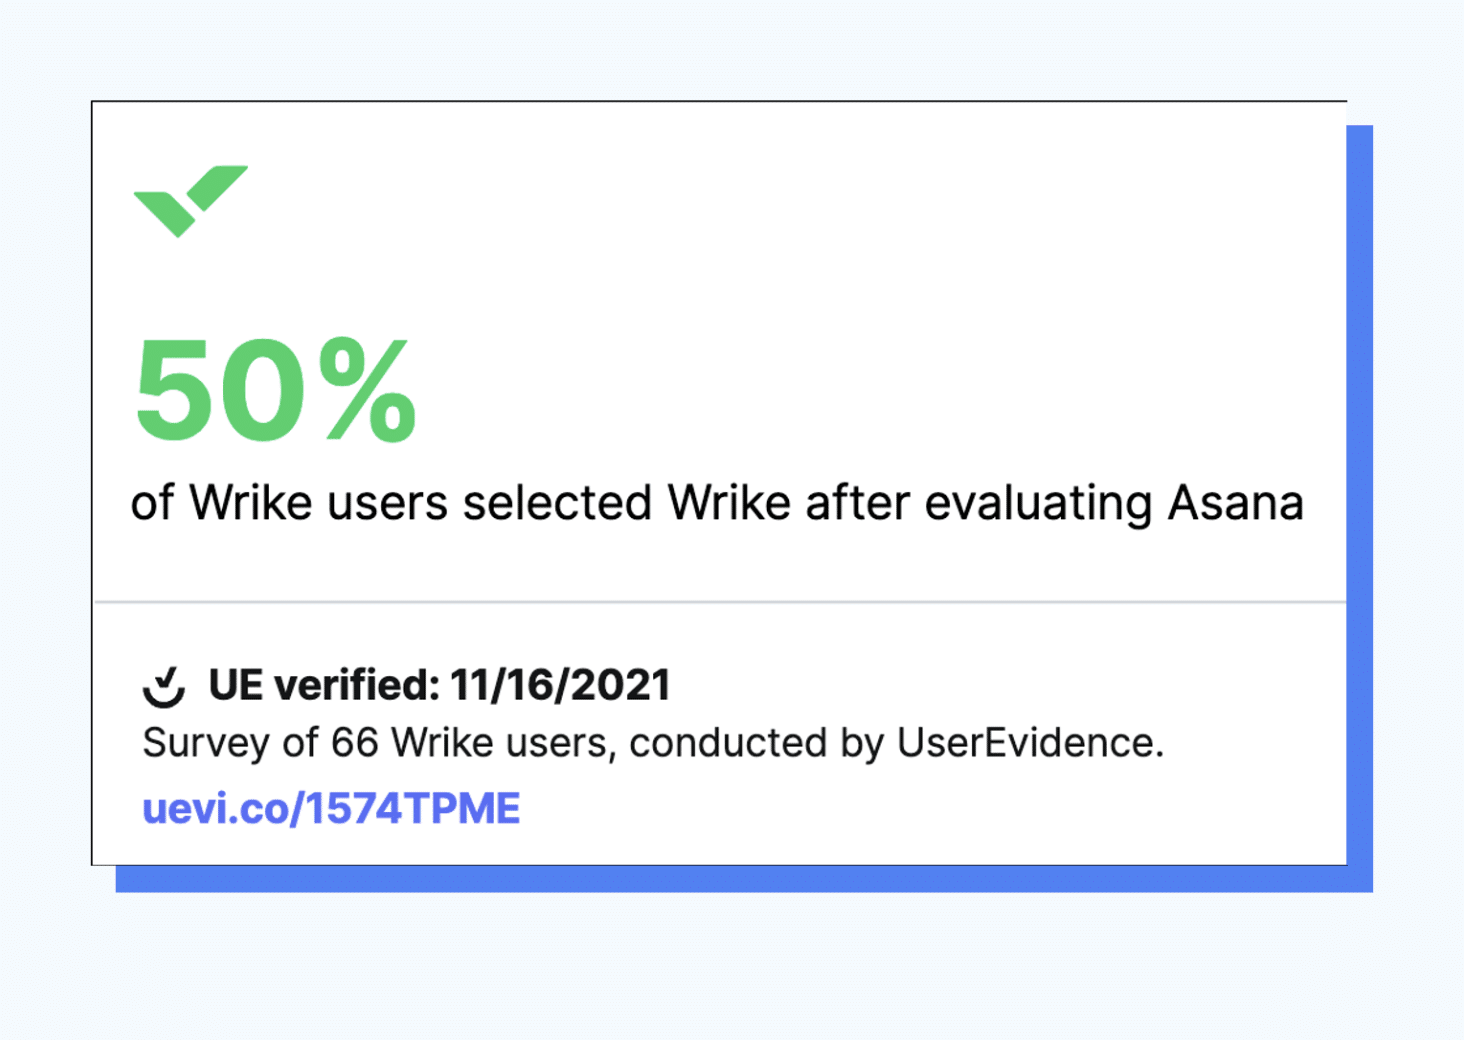
Wrike uses competitive selection data to give buyers confidence: 50% of Wrike users selected Wrike after evaluating Asana.
This simple stat leverages social proof and competitive positioning simultaneously, giving prospects confidence they’re making the right choice.
4. Why did customers choose you?

Absorb asks customers why they chose them over competitors like Docebo:
- 47% cited difficulty tracking learner progress
- 44% wanted a customized LMS
- 35% needed support for external training
This approach communicates your unique value proposition through your customers’ own reasoning.
5. Quantify time savings in ranges
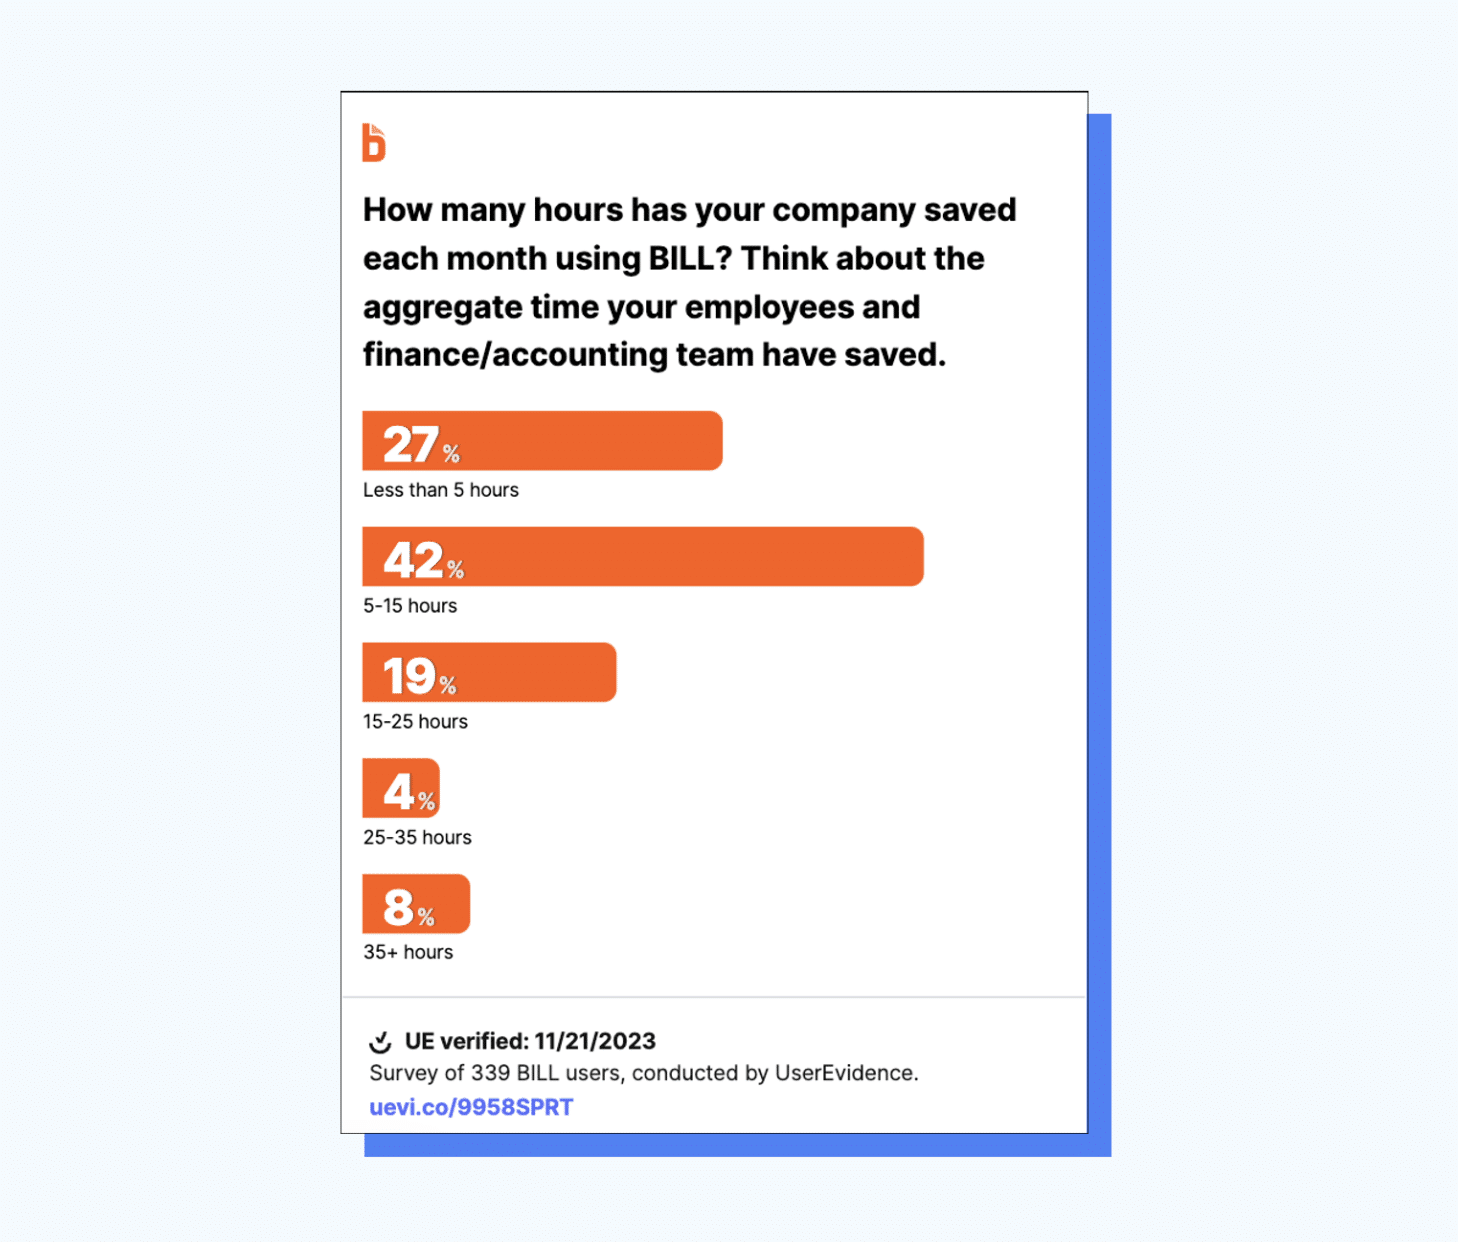
BILL makes it easier for customers to quantify time savings by offering multiple-choice ranges: “How many hours has your company saved each month using BILL?”
- 42% report saving 5-15 hours monthly
- 19% save 15-25 hours
- 12% save more than 25 hours
This method lowers the barrier to response while still capturing meaningful data.
6. Highlight specific feature adoption
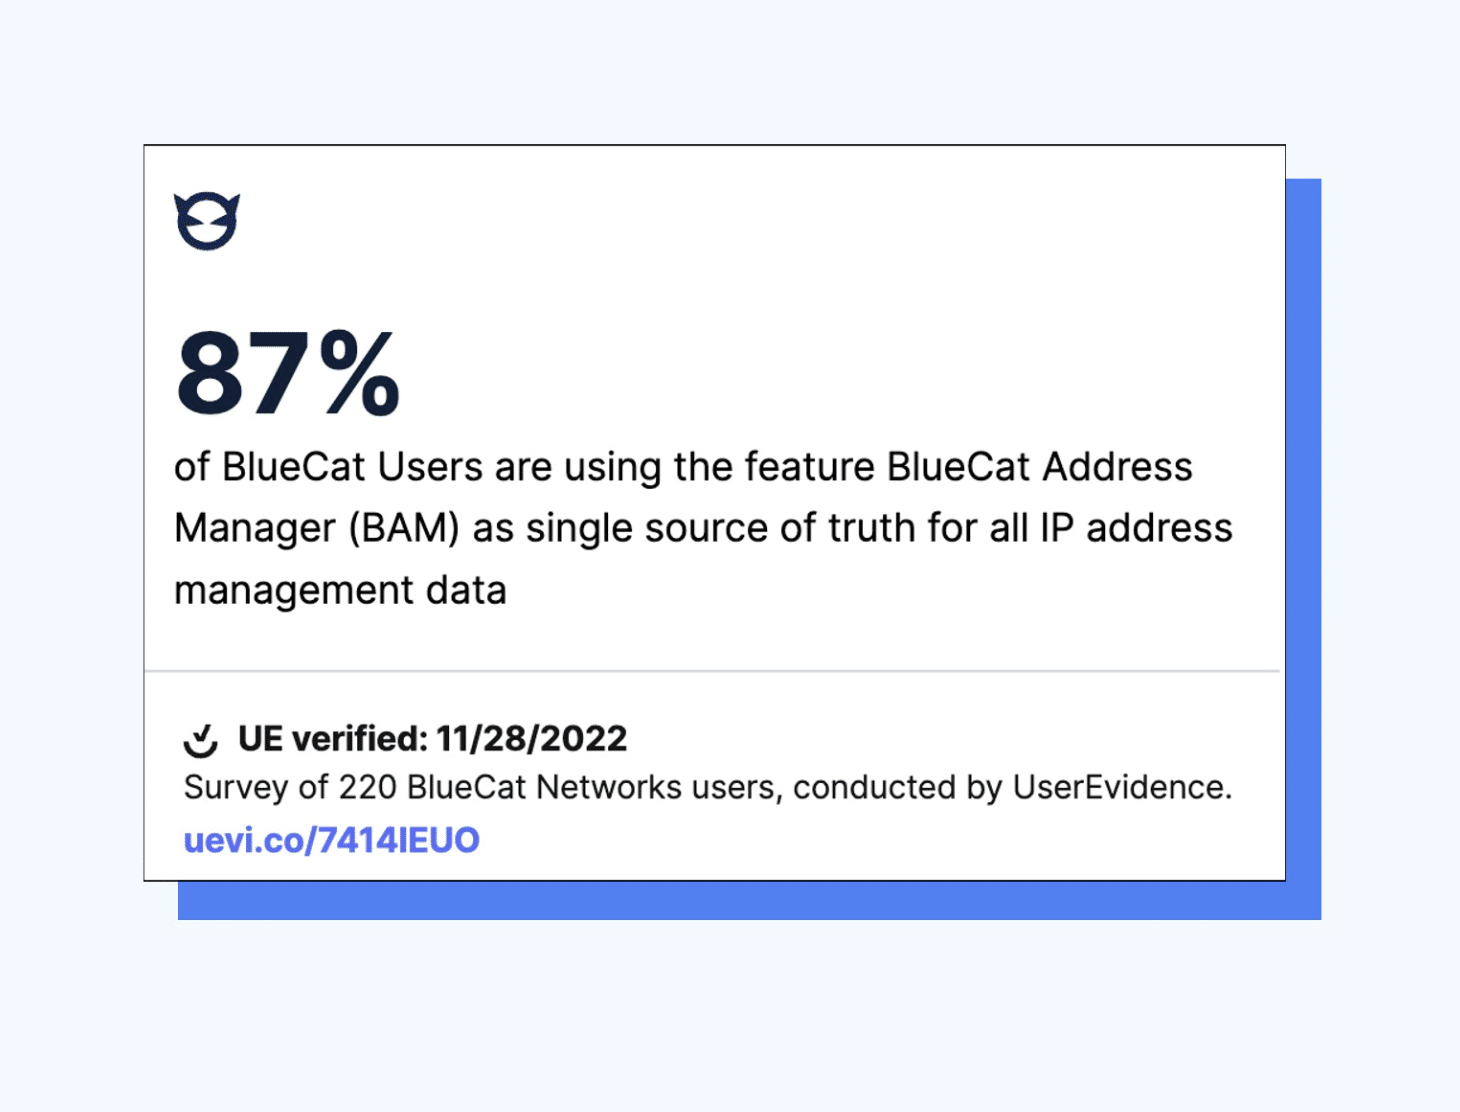
BlueCat focuses on feature-specific stats: 87% of BlueCat users rely on BlueCat Address Manager as their single source of truth for IP address management.
This type of data point validates feature importance and can guide both customer adoption and product development priorities.
7. Showcase time to value
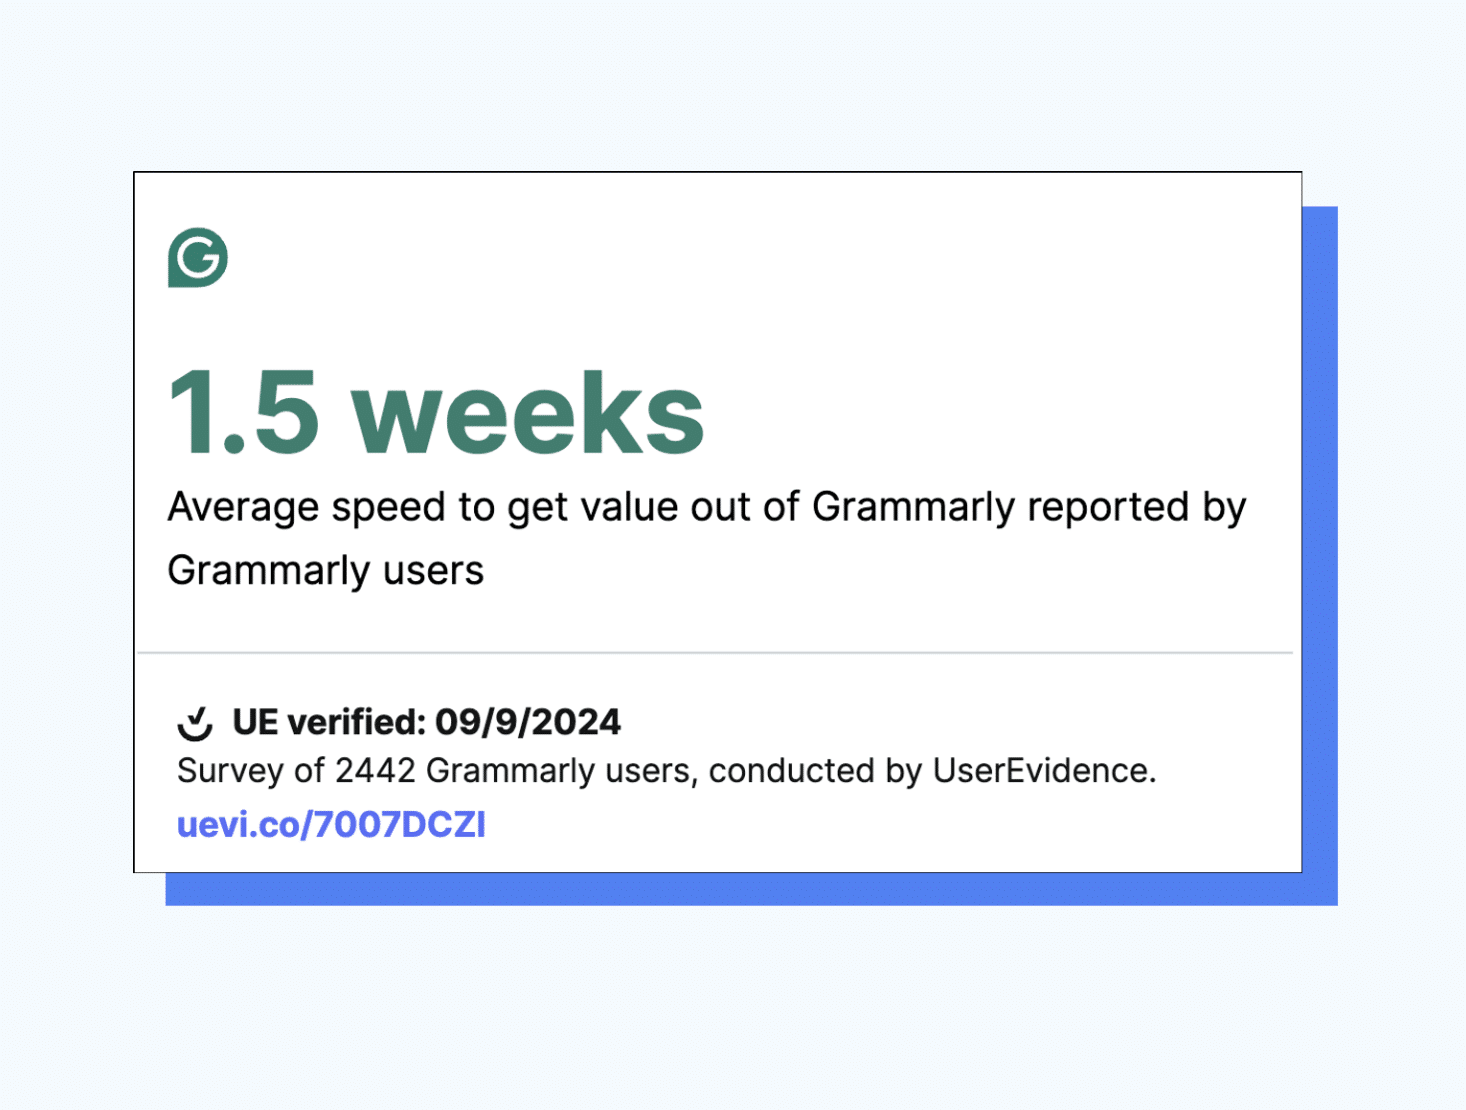
Grammarly addresses a common buyer concern with a simple stat: Average time to get value from Grammarly is just 1.5 weeks.
This directly tackles hesitation around implementation time and ROI timelines – a major friction point in many B2B sales cycles.
8. Segment your stats by audience
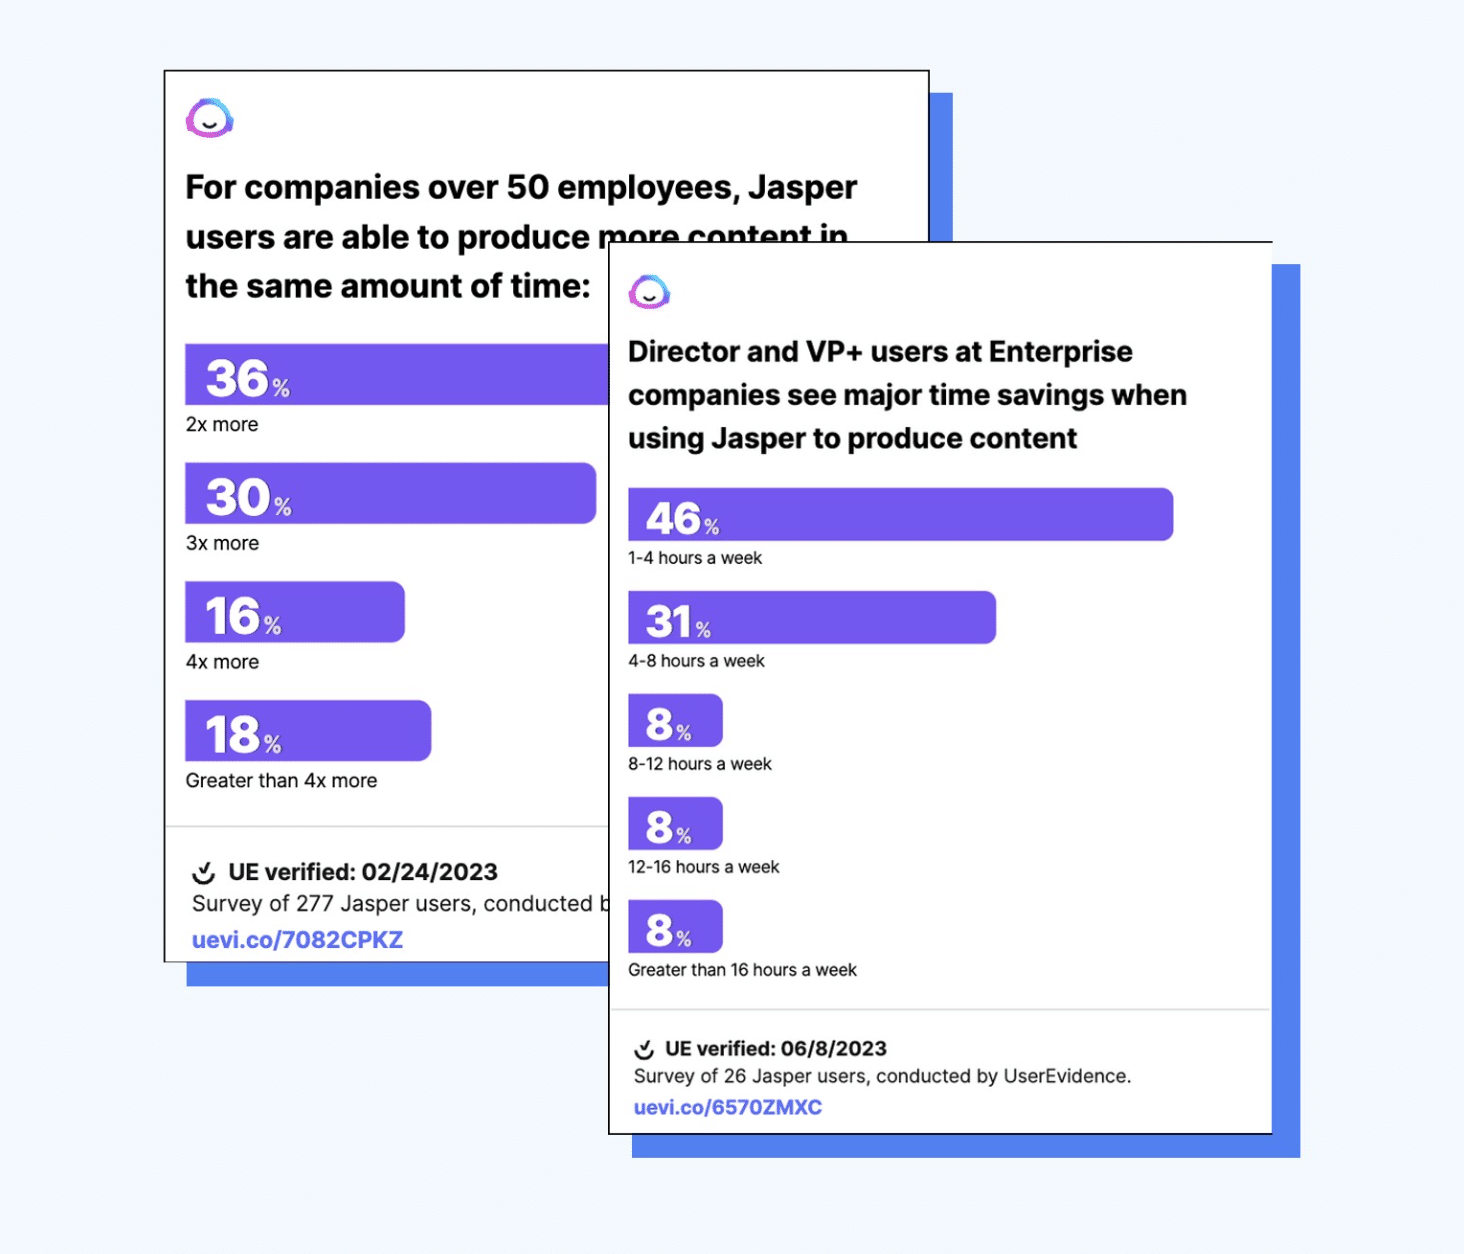
Jasper brilliantly segments their data to ensure relevance:
- For companies over 50 employees: 36% produce 2x more content, 30% produce 3x more
- For Director/VP+ users at Enterprise companies: 46% save 1-4 hours weekly
This targeted approach ensures your ROI stats resonate with specific buyer personas.
9. Showcase best practices
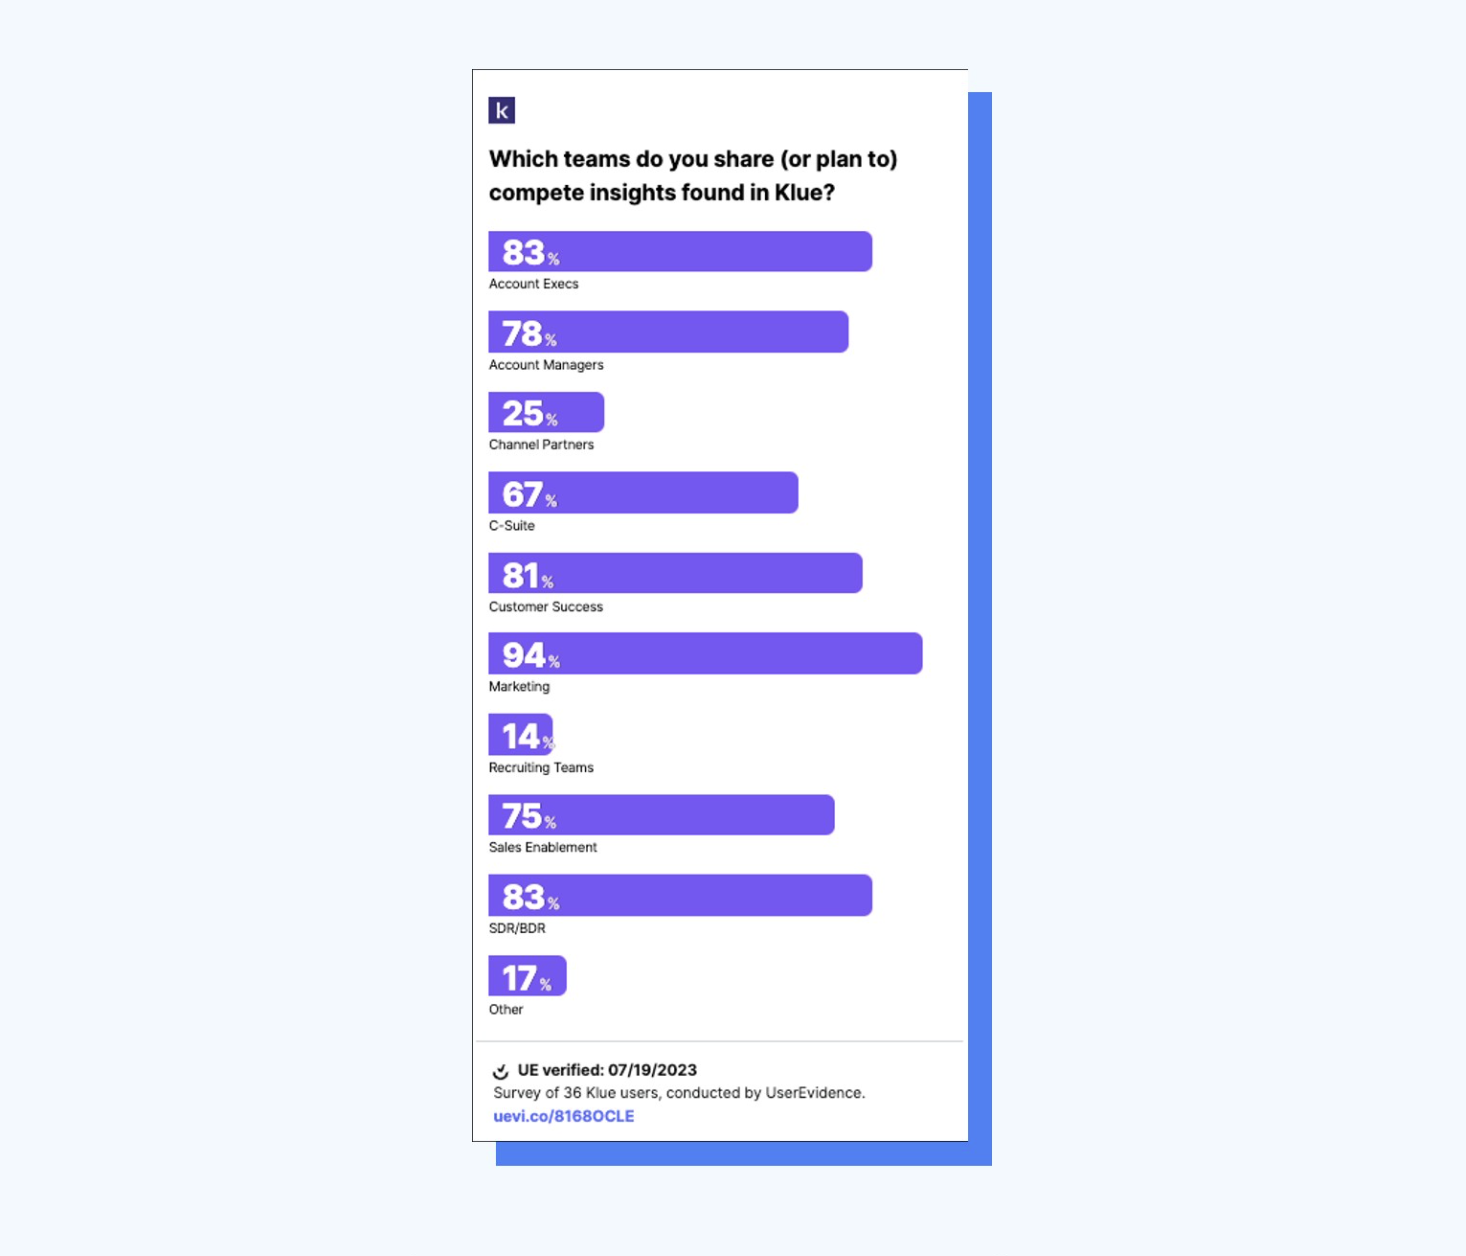
Klue uses data to educate customers on platform potential: “Which teams do you share competitive insights with?”
- 94% share with Marketing
- 83% with Account Execs
- 81% with Customer Success
This approach helps existing customers maximize value while showing prospects the full potential of your solution.
10. Highlight time to ROI
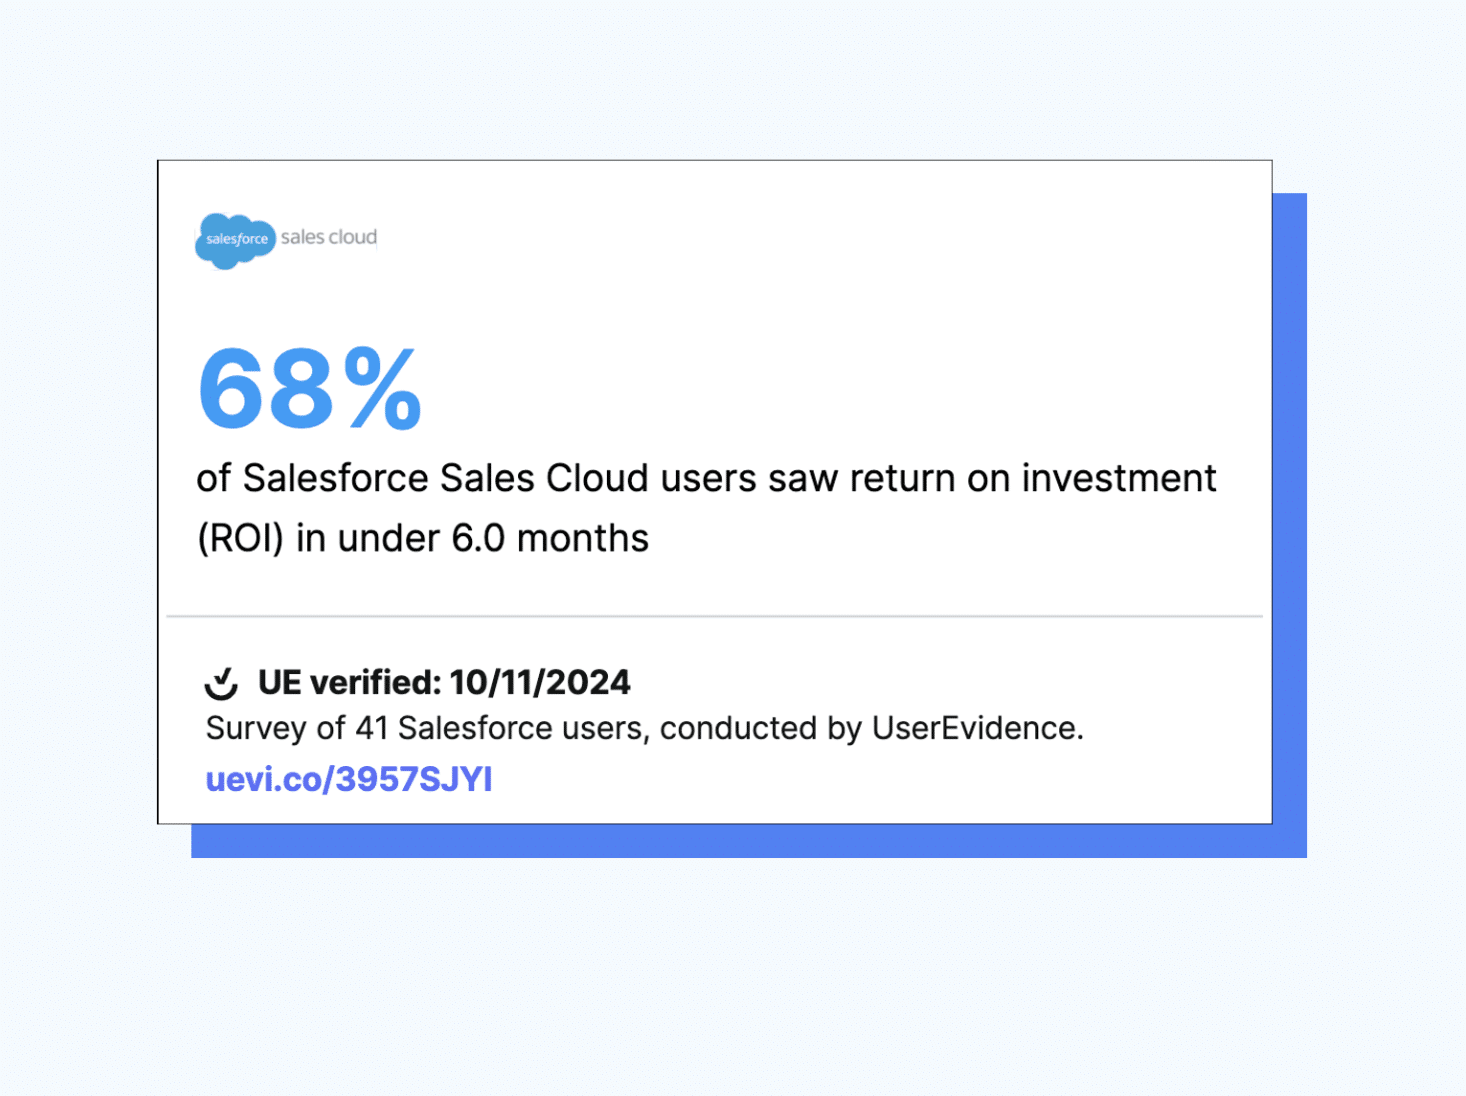
Salesforce directly addresses the CFO’s question with a powerful stat: 68% of Sales Cloud users see ROI in under 6 months.
This tackles the critical question of payback period and investment justification head-on.
Getting started with anonymous ROI stats
The beauty of anonymous ROI stats is that they’re often easier to collect than traditional case studies while providing a broader perspective on your product’s impact.
When designing your next customer survey, think beyond just asking “how much” or “what percentage improvement.” Consider asking:
- Where customers see the most value
- How they use your product
- Who they chose you over
- Why they selected you
- When they started seeing returns
These creative approaches can unlock powerful evidence even when customers can’t (or won’t) go on record with specific metrics.
Want to see how top B2B brands are gathering and using anonymous ROI stats? Mosey on over to UserEvidence’s Demo Ranch to learn how their platform makes it easy.

